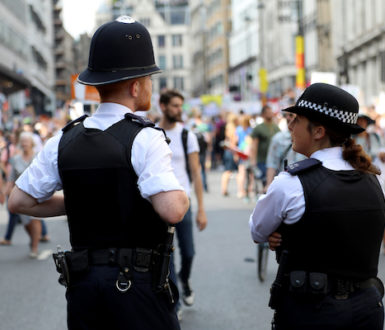
How dangerous is Britain?

When thinking about coming to a country and where to live, it’s common to be interested in the crime figures of a particular area. If you have only have your data via the media, it’s easy to get the wrong impression. Some places might seem more dangerous than they really are…and some areas might seem safer than they really are!
Crime covers many different offences, such as fraud, robbery, speeding. You might not worry about these when looking at places to live, so total crime figures are not very useful when it comes to assessing the danger to yourself or your family. However, violent crimes are much more likely to affect your personal safety, so we’re focusing on those. Crime figures come from county police services, which might cover both rural and urban areas.
Homicide
Getting killed is probably most people’s ultimate fear. The good news is this is unlikely in the UK. In the year ending March 2019, there were a total of 701 homicides in England and Wales. This includes murder and unplanned killing. This is a rate of about 12 homicides for every million people.
Scotland’s crime rates are usually lower than those of England, but figures cannot be compared because of the way the data is recorded. For example, in Scotland total homicides for 2018/19 were 102 (18 per 1,000,000 people). However, this figure includes death by driving, which is not included in the England and Wales figures.
Gun crime
Let’s move onto crimes involving ‘firearms’. This covers anything that shoots things… so it could be a gun or just pepper spray. In total, there were 9,787 crimes involving ‘firearms’ across England and Wales in 2018/19. This is 0.2% of all recorded crime (excluding fraud). There were 67 deaths.
The total figure includes air weapons (3,028), imitation guns/airsoft guns (1,407) and ‘other firearms’, such as CS gas and pepper spray (737). The firearm was only fired in half of cases.
Most crimes were recorded in urban areas. The top 3 areas were:
- West Midlands (0.24 gun crimes per 1,000 people; includes the cities of Birmingham, Coventry, Wolverhampton and Stoke-on-Trent)
- London (0.23 per 1,000)
- West Yorkshire (0.21 per 1,000; includes the cities of Leeds, Bradford, Huddersfield and Wakefield)
Knife crime
In 2018/19, there were an average 0.79 offences using a knife or sharp tool per 1,000 people in England and Wales in the year to March 2019. There were 250 deaths.
The places with the highest crime rates were:
- London (1.68 knife crime events per 1,000 people)
- Manchester and surrounding area (1.29 per 1,000)
- West Midlands (1.18 per 1,000)
- West Yorkshire (1.15 per 1,000)
Violent crime with injury
So while crimes with guns and knives is fairly rare, those aren’t the only ways you might get hurt. Let’s look at the levels of what is termed ‘Violence with injury’. This would include being punched or beaten up, resulting in either major or minor injuries (but not death, because that would be homicide). This is much more common. In England and Wales, the 3 places with the most offences recorded in 2018/19 were:
- Lancashire: (13.4 ‘violence with injury’ events per 1,000 people),
- West Yorkshire (12.7 per 1,000)
- Humberside (12.1 per 1,000)
Cambridgeshire had the lowest rate at 6.0 per 1,000 people. Just for comparison, the rate in London was 8.9 per 1,000 people.
Terrorist attacks
Terrorist attacks do happen in the UK and are terrifying occurances. However, your chance of dying in one is very small. Between 1 January 2001 and 31 December 2018 there were 103 deaths from terrorism in Britain (excluding 34 deaths in Northern Ireland). This gives an average of fewer than 6 deaths a year. This is about the same number as die each year from crashing as a result of an unfamiliar model of car.
Read more about crime levels:
- England and Wales – go to the Office for National Statistics website.
- Scotland – go to the Scottish official statistics website.
Image: Ashley Van Dyck/Dreamstime


